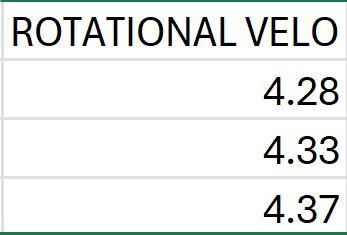
Thursday, May 15, 2025

Rotational Kinematics

Analysis:

radius = 0.05 m


radius = 0.10 m


radius = 0.15 m


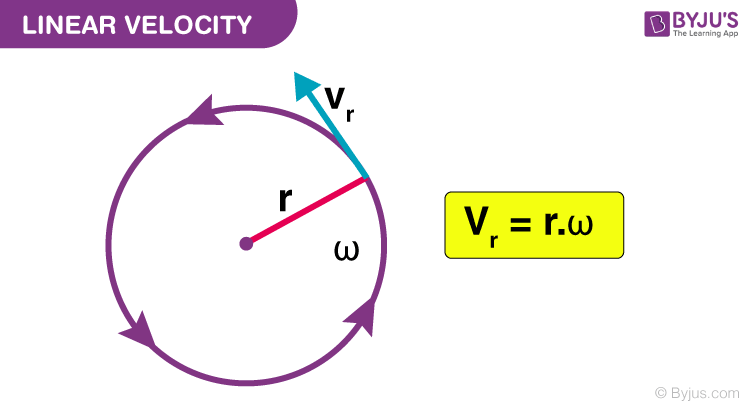
1. Use the velocity components to determine the direction of the velocity vector. Is it in the expected direction?

    Yes, the velocity vector was in the expected direction. We spun the bar clockwise and it shows.

2. Analyze enough different points in the same video to make a graph of speed of a point as a function of distance from the axis of rotation. What quantity does the slope of this graph represent?

    The angular velocity is represented by the slope of the graph.

3.  Calculate the acceleration of each point and graph the acceleration as a function of the distance from the axis of rotation. What quantity does the slope of this graph represent?

    The angular acceleration is represented by the slope of the graph.

CONCLUSION: How do your results compare to your predictions?

My prediction was that the acceleration vs radius graph would show a constant acceleration in the positive direction. 
The velocity vs radius graph showed that they are linear in the positive direction. 
My prediction was incorrect, but it makes sense since they are all parallel and going the same acceleration. 

Thursday, May 1, 2025

Project 2 Individual Contributions

1. I printed and was the "mechanic" of the cart. I did most of the work involving the vehicle (testing, constructing, designing, CAD, budget).

2. I created and designed half of the slide show. 

3. I communicated a lot with group in regards of maintaining a timeline. 

4.  Assisted where I could with the computational model (a little help).

5. I did most of the analysis of the cart (video analysis). 

6. Organized meeting times with Julie to work on the project.

Thoughts: I enjoyed the project. The manufacturing of the cart and its parts was great. The labs and other parts for this project felt rushed. 

Tuesday, April 22, 2025

Angular Velocity

This experiment explores how a falling mass influences a spinning system by converting gravitational potential energy into both linear and rotational kinetic energy. When the mass is released from rest at a constant height, it accelerates toward the ground while simultaneously causing the disk to spin as the string unwinds.


1. Data and Calculations for the 47.5 mm Disk

  • Trial Times: 2.07 s, 1.75 s, 1.59 s

  • Average Time:

tavg=2.07+1.75+1.5931.80st_{\text{avg}} = \frac{2.07 + 1.75 + 1.59}{3} \approx 1.80 \, \text{s}
  • Linear Velocity:

v=0.887m1.80s0.494m/s

2. Data and Calculations for the 28.6 mm Disk

  • Trial Times: 2.6 s, 2.57 s

  • Average Time:

tavg=2.6+2.5722.585st_{\text{avg}} = \frac{2.6 + 2.57}{2} \approx 2.585 \, \text{s}
  • Linear Velocity:

v=0.887m2.585s0.343m/s

3. Data and Calculations for the 19.6 mm Disk

  • Trial Times: 3.57 s, 3.88 s

  • Average Time:

tavg=3.57+3.8823.725st_{\text{avg}} = \frac{3.57 + 3.88}{2} \approx 3.725 \, \text{s}
  • Linear Velocity:

v=0.887m3.725s0.238m/s


Disk DiameterRadius (m)Average Fall Time (s)Linear Velocity (m/s)Angular Velocity (rad/s)
47.5 mm0.023751.800.49420.8
28.6 mm0.01432.5850.34324.0
19.6 mm0.00983.7250.23824.3

Conclusion:
The linear velocity decreases with decreasing disk diameter due to increased fall times. This
indicates that more energy is required to overcome the rotational inertia of smaller disks. Since it is taking longer to call the velocity is also smaller. The linear velocity and the angular velocity are comparable to group 3.  The uncertainty of our angular velocity is 23.0 +- 1.5. It does not fit in the uncertainty, but this could be due to human error as well as differences in measurment technique. 


Inclined track Lab

 Data gathered

Performing 3 trials, three different efficiencies were gathered to determine the uncertainty.   


The experiment output an average efficiency of 80.5% +- 5.25%. 


Conclusion
The cart had a higher velocity going down the incline and the magnets ensured it did not hit the bumper and returned the cart up the incline with a smaller velocity. The total efficiency that the cart going up and down the ramp was 80.5% +- 5.25%. 

The efficiency from group three on a leveled track was calculated to be 90.285% +- 5.09%. The velocity changed only 10% on average after the cart hit the bumper. This shows that the incline has a large effect on the carts total motion and the flat surface helps retain the motion.

The leveled track would be a better way to measure since it is easier to gather data and less factors like angles and friction becoming more of a problem. The inclined track was also harder to measure the heights and positions since we have to use trigonometry to calculate.


Monday, April 14, 2025

Analysis of Coefficient of Friction and Normal Force

Constant Height (1 & 2)


With a constant height of 0.5 m, the friction force and the normal force was calculated in excel using an input of the equations derived. The friction coefficient in this experiment with constant height was 0.94. This does not fit in the predicted range of 0.2-0.6. since the more mass was added per trial, the friction force increased higher and higher.


Thursday, March 27, 2025

Cart with hanging mass


Predicted vs. Measured Velocity
The predicted velocity is calculated using the formula shown and the measured velocity is from video analysis. The velocity predicted is considerably lower than the measured velocity. This could be due to experimental error.

Velocity Predicted: 0.416 m/s
Velocity Measured: 0.743 m/s +- 0.064

Tuesday, March 25, 2025

Hanging Bridge Lab work


Where do the curves match? When the mass is .105 kg.
Where do the lines diverge? When the mass is >.105 kg.

What does this say about the system? Once the center weight is larger than the side weights, the accuracy is affected.

What are the limitations on the accuracy of the measurements and analysis? The precision of our measuring equipment, the way the mass is distributed, and perhaps friction from the pullies.

How does the vertical displacement of an object suspended on a string between two pulleys depend on the mass of the object? The mass object creates a lot of variability on the pulley system and the angles from the string which are created from the weight being added. The more mass added the higher the displacement and angle created.

Did your measurements of the vertical displacement of object B agree with your initial predictions? If not, why? Yes, the measurements agree to a reasonable level, though not accounting for the friction of the pulley and uncertainty from the measurement devices.

Results in general terms - The mass of object B being added to the string at a state of equilibrium results in a displacement of object B and creates a higher tension in the ropes and steeper angles on the ropes on either side.

Do the pulleys behave in a frictionless way? No, the pulleys do not act in a frictionless way and affect the results we determine.

How can you determine if the assumption of frictionless pulleys is a good one? By finding the displacement using the formula derived on Thursday, (Ltan(sin^-1(M/2m))/2), we can compare to our ideal frictionless calculations and see if the results are reasonably close.

What information would you need to apply your calculation to the walkway through the rain forest? The pulleys dimensions, the dimensions and mass of the rope bridge, (rain, wind, humidity, heat, animals?), human mass.

Rotational Kinematics

Analysis: radius = 0.05 m radius = 0.10 m radius = 0.15 m 1.   Use the velocity components to determine the direction of the velocity vector...